
Illiquidity and Expected Return
Investors demand a premium for illiquidity and fund managers supply it

Investors should be rewarded for taking on illiquidity risks. It is a standard risk factor in many capital market models. However, realizing this premium requires that the other side delivers it. In practice, this illiquidity premium is typically provided by leverage.
I’ll discuss some thoughts related to illiquidity: transaction costs, volatility, and fund structure.
A final observation is that technology and innovation are blurring the line between the public and private markets, slowly eroding information gaps around illiquidity. As Matt Levine likes to say, “Private markets are the new public markets”. However, the illiquidity premium will remain, as fund managers need restrictions to implement their strategies.
In sum, the illiquidity premium is not ‘free’; it is largely manufactured through leverage and structural constraints rather than arising from a factor itself.
The Illiquidity Premium: Demand and Supply
The notion that investors should get rewarded for illiquidity is common sense. If you buy $100 of a daily-valued mutual fund, whenever needed you can convert tonight’s value into cash by the next day. However, if you invest in a private fund that is only open once a year, you risk that you won’t get your money in an emergency, so you should demand an extra bit of compensation for this risk. In a frictionless economic world, you have given the fund manager the option to deny your redemption request. You should be compensated for the value of this option.
However, this premium is one side of the transaction: the demand side. What is happening on the supply side? How does the market generate the return? What are the fund managers doing with this ‘implied option’?
In most cases, the fund managers explicitly or implicitly leverage the portfolio. The typical core real estate fund, for example, is 20% to 25% levered, while more aggressive ones are 60% levered. Here are some examples how leverage can be used to provide the Equilibrium risk premiums implied by my basic capital market model as presented in Technical Note 3: CapMkt-Model-v1 (and updated with some November parameters)[1].

For private equity, I show two ways where I can replicate the nominal return from the demand side: simple CAPM beta and borrowing against the risk-free rate (Method 1) or borrowing against a high yield bond (Method 2). Private equity managers use explicit leverage as well and historically they were famous for the leveraged buyout, where the borrowing is embedded in the company. In a few cases, these funds bought a small public-listed company or a small family run business, immediately went to the bond market and borrowed against the company’s assets, and used the bond proceeds to pay a big dividend back to the fund. However, private equity seems to have tapped out the unrealized small cap market and has moved into growth or consolidation strategies: funding promising small companies for rapid expansion or rolling up into larger firms. Really, these strategies are just beta plays on equity, hoping to earn small cap premiums with BB or B borrowing rates (i.e., below investment grade). In theory, it works on average, but the tail events on the upside and downsides are larger.
For infrastructure, I consider this sector to be ‘low-beta private equity’. Using a simple CAPM approach (Method 1), adjusting the beta downward to 0.962, I can match the demand side. With a slightly lower beta and 30% leverage (Method 2), I can again match the demand side return.
For private debt, I start with a speculative grade yield—8.77%--reflecting what I estimate a B-rated bond would yield and apply a 4.0% default rate with a 30% recovery price and I can match the demand side returns quite easily. A wide array of assumptions work.
Here what it looks like on the real estate side. I start with a low return for unlevered commercial real estate: only 4.5% net-of-all maintenance costs, which is about what corporate bonds earn. I admit that it probably underestimates the return[2]. These conservative estimates have the more aggressive funds earning about 100 bps more through leverage. On the other hand, I’ve assumed borrowing at the risk-free rate, an unrealistic assumption. I think using bank loans would provide a better estimate.

This illiquidity option is valuable to the general partner to protect the fund. The fund has borrowed and may be locked into loan contracts, collateral agreements and properties or companies that cannot be easily undone. (Hedge funds are similar. They have built up an elaborate mix of leverage in long and short positions, many of them bespoke contracts with counterparties. This is much harder to do if the fund has to maintain daily liquidity needs.)
Once leverage and credit risk are made explicit, the ‘illiquidity premium’ largely disappears as a distinct factor.
Illiquidity, Transaction Costs and Volatility
One way to measure illiquidity is the size of the bid-ask spread in markets. Here is a summary of the estimates of bid-ask spreads, market size and my estimates of equilibrium return and risk. The expected risk premiums are described in Technical Note 3: CapMkt-Model-v1 and updated with some November data and parameters.
In this model I set currency volatility the 6% to 9% range and set the risk premium to zero[3].

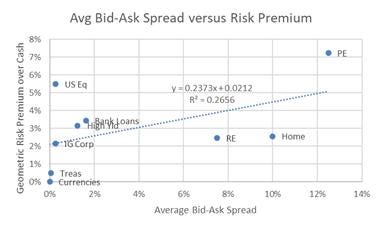
There is some relationship between illiquidity and risk premium and (not shown) a slightly stronger relationship between illiquidity and volatility. Within fixed income, we see a strong relationship: as the bid-ask spread widens (worse liquidity) the risk premium rises from Treasuries to corporates to high yield and to bank loans. However, one huge outlier is US equities, the largest market, which has a large risk premium and high volatility yet has very low transaction costs relative to other asset classes.
If anything, bid-ask spreads appear to be related to the size and standardization of the market plus size. The large markets--currencies, government bonds and large cap equities--not only have size, but fewer individual securities. The smaller markets—bank loans, private equity—have many securities and smaller markets. Another outlier—the housing market, with a moderate risk premium—has large transaction costs because despite its aggregate size, it highly splintered across tens of millions of households.
Fund Structures
As noted earlier, fund structures with limited openings, gates and redemption limits are common in private assets and hedge funds. This gives the fund managers the freedom to invest longer term—not having to worry about raising cash for redemptions. But it also cushions the fund from more frequent disclosure and when they do disclose, it’s at an NAV calculated by the fund. This gives managers another huge advantage: the ability to report smoothed returns. Private managers of course will report the volatility of their NAVs, which underestimate true economic volatility, which I estimate to be 50% to 100% higher. Cliff Asness calls this Volatility Laundering.
One interesting twist is how fund structures helped lower costs in low liquidity markets for some investors. In particular, buying or selling high yield bonds, an asset class that can have very high transaction costs for single securities: up to 60 or 70 basis points, can now trade the asset class as a whole for 3 basis points. Bond dealers and ETF managers will trade whole packages of bonds with similar characteristics and have been doing so for decades.
Technology and Financial Innovation
Illiquidity and the costs of trading are eroding under the forces of technology and innovation in the financial sector. The sharp line between public and private assets is fading.
This is not a new phenomenon. The US equity market is a great example of how transactions costs and speed have improved over time. In the late 1700s, traders met in lower Manhattan and formed what would become New York Stock Exchange. They standardized market requirements, trading rules, hours, etc. which facilitated trading. Every trade was recorded manually on pen and paper and prices were published. Commissions were regulated and settlement of a trade took days. This all got bigger but by the late 1960s the backlog of paperwork—still done manually--became overwhelming and the NYSE would close on Wednesdays in trying to catch up. Slowly, computers took over. Traders and investors got savvy and more adept with these technologies: speed, depth and time for trading all improved and expanded into other markets. In the 2010s the arms race in speed culminated in high-frequency traders (HFTs) who dealt with microseconds and spent hundreds of millions trying to get as close to the exchange’s servers as physically possible. HFTs were very successful at first and widely reviled, but competition eroded the excess profits, which are now much lower, but not inordinate and many firms left the market. I consider HFTs to be hedge funds operating as pseudo market makers.
Currently, it is fashionable for founders of companies to stay private and avoid the hassles of being a public company. However, one problem with staying private is paying off the employees with stock options who have been waiting years for a payoff. The founder may find being private better, but there are dozens, perhaps hundreds, of key employees that would like to liquefy some of their paper wealth and diversify (and the private equity funds would like some cash distribution, too). Thus, we see a market ecosystem that is emerging to cater to a) the excess supply of equity held by employees and initial private equity investors, and b) the demand for this stock by institutional and retail investors.
For example, private assets—real estate, debt and equity—now have quasi-public markets. Here are some sites with indices and marketplace data:
Forge Welcome To Forge - The Place To Buy And Sell Private Market Shares,
And MSCI’s All Country Public + Private Equity Index.
Another Matt Levine theme is that the blur between public and private runs the other way, as well. With the current administration proposing easing of disclosure and governance rules (or is it norms, not rules?), the public markets may become more like private markets with their looser disclosure and less deference to smaller, ‘nuisance’ shareholders (Public Markets Are the New Private Markets - Bloomberg).
All this new information about and access to private assets does not eliminate the illiquidity premium. It may lower transaction costs, as more information about actual trades allow for better estimation of returns and risks. As the graph above shows, we have huge outliers in the relationship between transaction costs and risk premiums.
At the end of the day, fund managers will need restrictions on liquidity to implement their strategies because they are:
Dealing with assets and liabilities with no immediate marketability or resolution: real estate, start-up companies, leases, syndicated loans, etc.
Using leverage
The deciding factor on liquidity seems to be related more to the size of the market than risk. The currency, Treasury and large cap equity markets are the largest markets, with hundreds of billions traded each day. Are large markets because of liquidity? To some degree, yes, I think there is a synergy, but as the relationship above shows, it’s not very large.
Summary
Investors are getting better information about private assets and transaction costs are improving. This doesn’t mean much change for expected returns--but the ability to diversify further is improving at the margins.
Illiquidity itself does not mechanically generate higher returns. The premium exists because investors allow managers to manufacture it through fund structures and leverage.
Caveat emptor.
[1] I’ve changed the risk premium here to report in geometric terms. As always this runs from calculating arithmetic returns and volatilities for levered portfolios and then calculating the geometric returns from those two measures.
[2] One issue is my huge underestimate of the size of the global real estate market—I use Preqin’s estimate of funds that report to their data base (about $2 trillion). If we use a more plausible size at $14 trillion and plug it into my model, I get a risk premium about 25 bps higher and slightly lower (1 or 2 bps) of costs in the credit markets, making equity-like returns with leverage more plausible. I will research this in future versions.
[3] This is just basic interest rate parity theory and implies investment in money market funds in foreign currencies hedged back to USD, but this is in conflict with the 6.0% spot currency volatility. I acknowledge the inconsistency.