

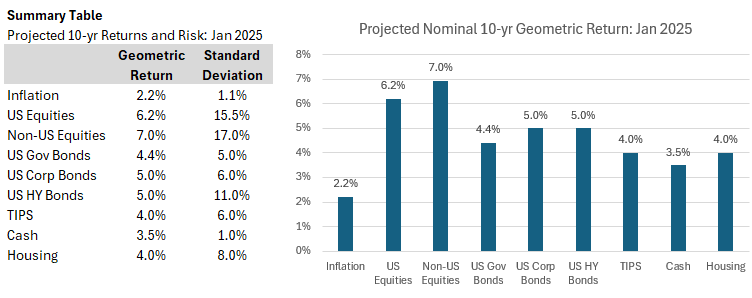
Here is my current projection for returns and risk in the capital market over the next 10 years.
When I graph this on a return/risk chart, the relationship is tight, but the slope is much lower than the historic averages. This is because cash returns are now high relative to history, and equities are slightly overvalued. High yield also appears overvalued.
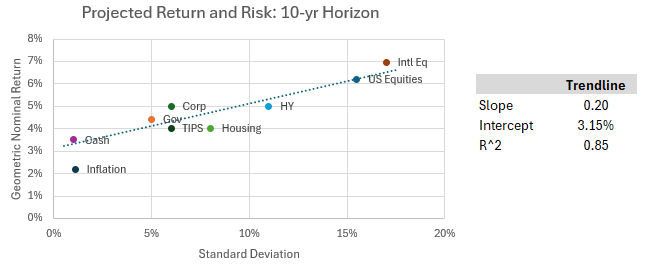
One interpretation of the intercept of the trendline is that it is the risk-free rate. So, according to this regression analysis, the risk-free rate in nominal terms is 3.15%.
How does this compare to other projections? I like to follow AQR Capital Management. They have numbers as of December 2024, so I am a month off (in which equities did well and investment grade interest rates stayed the about the same), so there should be some minor differences. For bond returns, AQR adds in a ‘roll-return’ of anywhere from 0.2% to 0.8%, but I don’t. I will go over the pros and cons of adding roll-returns in another post. I think they are fine for short term forecasts, but not as relevant for longer term ones. Thus, my estimates are generally lower than AQRs.
Here are AQR’s numbers versus mine:
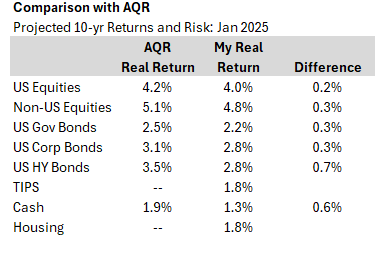
AQR’s assumptions are consistently a little higher, as expected. As for cash, I’m sure I am lower because I believe the r-star rate is quite low. (See my previous post Observations on macroeconomics). As for high yield, the spreads in this sector dropped almost 0.3% in January (no surprise, as this is highly correlated with the equity market). Along with an 0.2% roll-return, we are left with only a 0.2% difference—quite possibly explainable by differences in default and recovery rates.
All in all, I don’t think our assumptions are very different.
I’ll consider two other academic pieces.
First, Aswath Damodaran, in annual updates to the market, dedicated a whole post to equity market valuation. Musings on Markets: Data Update 2 for 2025: The Party Continued (for US Equities)
Here are some of his points:
Stocks have done very well historically. The geometric risk premium over cash is 6.6%. Bonds had a premium of 1.2%.
Thus, with cash rates at 4.0%, equities should be earning 10.6% and bonds 5.2%.
The P/E ratio for US stocks, no matter how measured, is extremely high.
With the 10-year Treasury yield above the inverted P/E ratio, bonds look more attractive.
He estimates a forward risk premium of 4.3% over the 10-year Treasury bond, resulting in an 8.9% return.
The second academic piece is Long-Run Asset Returns by David Chambers, Elroy Dimson, Antti Ilmanen, Paul Rintamäki :: SSRN, written in October 2024. The authors review the literature of the returns of stocks, bonds and housing, going back over two centuries.
Here’s how I summarize their survey:
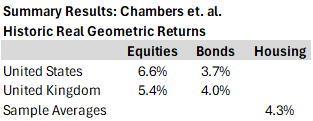
Equity returns in the 1800s were much lower than in the 1900s. Equities barely beat bonds in that century. Stocks did very well in the second half of the 20th century.
Nominal and real interest rates have been declining for centuries. The 20th century is an outlier for its high inflation (and high growth).
Housing doesn’t perform as well as equities and barely edges out bonds. I tend to agree with this. (However, most housing is bought on leverage—people take out a mortgage at multiple times what they have put down, so the returns can be much better than this. But as the late 2000s show, it can drop 40% as well.)
According to these numbers, with inflation around 2.0% stocks should earn between 8.6% and 7.5%, higher than my simple projection.
Summary
US stocks and corporate bonds are a bit overvalued, while government bonds are fairly priced. Cash also looks good.
Timing between these is extremely difficult (the markets are very efficient). I would only take very modest tilts from target positions.
In my opinion, a 4.5% 10-year Treasury yields suggests that nominal growth should be around 5.0%. So, some combination of 2.0-3.5% inflation and 1.5% to 3.0% growth are priced into this.
I will write and post a lot more about these topics in the future.